Representations inform our capacity and our need to imagine ‘the city’
(James Donald, 2000, p.53).
Cities are incredibly interesting. And we all experience them differently. When we think of New York, Istanbul, Tokyo, distinctive images or narratives comes to mind, depending on our cultural and social background. They are incredibly complex as well, subject to constant change. This complexity makes our understanding of a city or a region almost impossible. We need to make useful conceptual shortcuts in our thinking in order to have a glimpse on “what is really happening” (Shields, 1996).
The notion of “planning through debate” (Healey, 1992) made planning communicative. Discourse can produce meaning and unquestioned knowledge and throughout this process of meaning-making, it requires creative knowledge.
Visualization in its different forms helps us to understand the city, makes it available for analysis. If we would understand what’s happening, then we might have a better chance to intervene, to plan, to design and sometimes to resist.
We face a great challenge today, besides the expected complexity of our cities; there is the “big data” phenomenon. The ability to communicate data is a precious skill today. We are producing 10 times more data than we have produced 5 years ago. It is getting incredibly difficult how to make sense of all these data, how to analyse it, how to see through, how to visualize it, how to communicate it. Despite the abundance of tools, know-how to process and share all these information, we lack reasonable tools in urban planning, where interesting and meaningful information can be made visible.
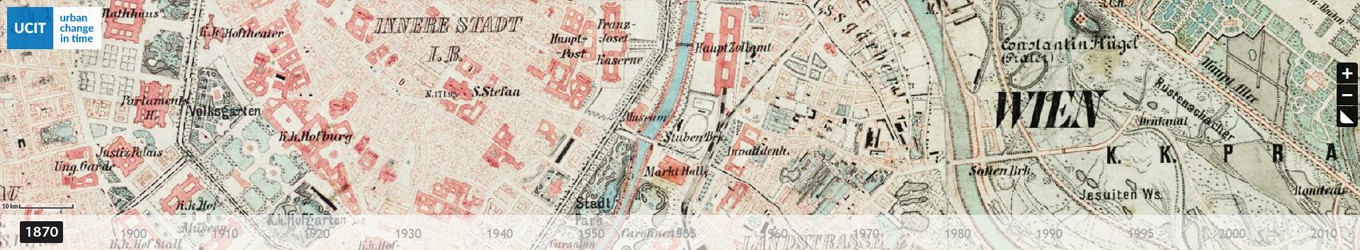
For empirically analyzing this hypothesis, I chose to create a web application, where one can travel through time in the city of Vienna. The tool makes Vienna’s development visible, starting from 1870 till today in a user-friendly manner. Here, my purpose is to make the historical geo-data effortlessly available to the public and professionals, to interact public and media attention on urban growth (in this case) by making the urban data interesting and just one-click away. This project potentially contributes to meaning-making of public data and makes it available to further critical analysis.