The Netherlands from a new perspective

waag_800x434

A very interesting data visualisation project of all buildings of the Netherlands by developer Bert Spaan from Waag Society.

The data for this map are from the ‘Basisregistraties Adressen en Gebouwen’ (BAG). Dutch municipalities are delivering the basic information, the Dutch register, ‘the Kadaster’, administrates the data. If there are any mistakes of the data, people can report and omissions themselves at the Kadaster. By doing so, they contribute to the project and make it a crowdsourced map!

Read more: The Netherlands from a new perspective By Bert Spaan Waag Society , Ron Boonstra, September 02, 2013.

Journey Through Time by Swisstopo

swisstopo_800x434

The most impressive accomplishment for a long-term preservation of geospatial data from Swisstopo

The main inspiration behind the UCIT was the Journey Through Time application by Swisstopo. The Swiss Federal Office of Topography has recently updated and extended the application.
The Journey Through Time part of it, is a combination of digitized maps from 1844 to today. The main purpose of the Swiss Government was to make geodata freely available to the public at no cost, using open source software.

Swiss cartography is renowned for its accuracy, quality and artistry and thankfully, they have produced a wonderful portal that allows you to explore the rich history of their work. Enjoy!

7000 people in one week!

Since the project is published on the national newspaper Der Standard, in one week more than 7000 unique visitors visited the website. 64% were spending more than 30sec. UCIT has received valuable reactions in a short time span and there are some open questions that I would like to answer here.

why did I not use Open Government Data in UCIT?

The answer is simple, there were no sufficient data that I could use which has certain uniformity and certain intervals such as 10 years. Principally I would of course support the open government data initiative. If there would be possible alternatives, I would be glad to replace it with the existing ones.

why use these particular data-set to show the urban change?

I am aware that the data is not fully suitable to show the transformation of the city. But you would be surprised how impossible that is to find an ideal data-set if you want to add time-space character to it. My long term wish would be to turn this data into a more appropriate version of it but now we have the possibility to use/analyse these data to make the most of it.

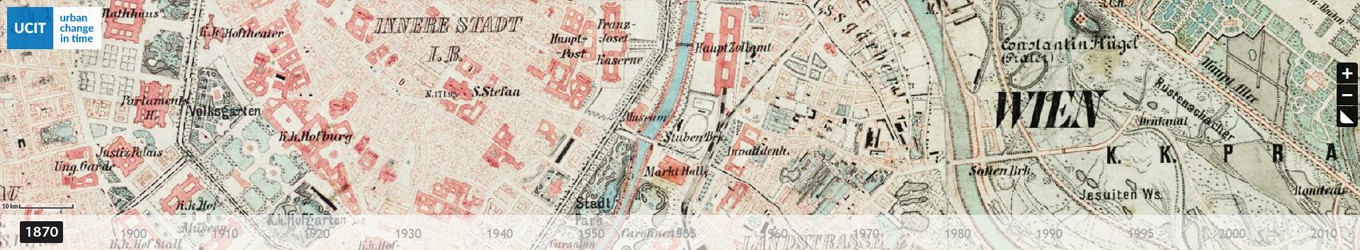
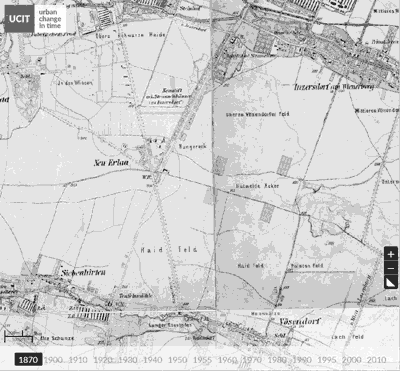
why the quality is that bad especially between 1910-1930?

it is simply because during that time these maps were produced with a lower scale (1:75.000). And if we think that these maps are mostly paper maps which have been lying in the drawers of an archive, it was an expected outcome that they have a certain limited quality.

what is so special about this application?

not so much! Here my purpose was to make urban data interesting to the media and public, just by creating an application which has a bit of an unconventional way of showing urban data, showing the City of Vienna from a different perspective. We need to re-examine the city and keep it open to further critical analysis and showing the urban data in a different way may lead to reveal unquestioned knowledge and creative thinking.

UCIT on net:25 Conference

The University of Vienna is celebrating its 650th Anniversary in 2015, the Vienna University of Technology has its 200th birthday, and 25 years ago the foundation of the Austrian Internet was laid at the University of Vienna. 650 Years of University of Vienna, 200 Years of Vienna University of Technology and 25 Years of Internet in Austria was celebrated on net:25 Conference  with the event-trilogy “net:future”, “net:science” and “net:art”.
UCIT was there on the second day which was dedicated to net:science and invited the national and international research community. ACOnet as the Austrian research and education network presented showcases how to use the network infrastructure for research purposes.

UCIT-on-net25

UCIT is ONLINE!

We are happy to announce that starting from today, the 1st of May, we are ONLINE!

For the first time, an application brings together and shows the extent of development in Vienna from 1870 to today.

The city that you were born in, the city that you’re living in, the city that you are curious about,…

Are you ready to explore Vienna from a complete different perspective?

Get Started

UCIT

Time-Lapse Ride to Trade Center’s Top

timelapse_tradecenter

Another very interesting time lapse visualization: The elevators to the observatory atop 1 World Trade Center show an animated time lapse that recreates the development of New York City’s skyline from 1500s to today.

An imposingly realistic vision of the old 1 World Trade Center, the ultimately doomed north tower, will begin appearing next month in a most unlikely place: the five special elevators servicing the observatory atop the new 1 World Trade Center.

From the moment the doors close until they reopen 47 seconds later on the 102nd floor, a seemingly three-dimensional time-lapse panorama will unfold on three walls of the elevator cabs, as if one were witnessing 515 years of history unfolding at the tip of Manhattan Island.

For less than four seconds (roughly proportional to the time the twin towers stood), jarringly familiar pinstripe facades will loom into view on one wall of the cab. Then, in a quick dissolve, they will evanesce.

Read more: On Time-Lapse Rocket Ride to Trade Center’s Top, Glimpse of Doomed Tower By The New York Times, David W. Dunlap, April 19, 2015.

The Changing Religious Landscape of Vienna

religiousdiversityinVienna

Another very interesting dynamic visualization, this time about the change in religious landscape of Vienna. The research project WIREL created these dynamic visualisations in order to explore the role of religions in shaping the social and demographic structure of the population of Vienna. The city of Vienna had a large Catholic majority until the 1970s. Secularisation and a strong influx of international migrants diversified the religious landscape since then. Fertility and marriage behaviour are other major forces shaping the religious composition of Vienna.

Read more: The Changing Religious Landscape of Vienna By WIREL, Ramon Bauer, Tina Frank, Anne Goujon and Clemens Schrammel, April, 2015.

The Age of Megacities

theageofmegacities_1024x589

The world is a crowded place, with more than 7 billion people on the planet as of 2014. About half of this population lives in urban areas, and ongoing migration into city centers has given rise to the megacity—a metropolitan area with 10 million people or more. Today the world has 28 megacities, according to the United Nations, and that figure is projected to increase.

The Age of Megacities project is a Story Map from Esri where you can explore the historic growth of ten of today’s largest cities during the past 100 years. It allows to follow the urban extend in 4 or 5 time ranges depending on the available data. Additionally they have included The Future of Cities by the 2050 story map according to United Nations projections. It includes the cities expected to swell past 10 million residents within 10 years. These cities are Kinshasa, Democratic Republic of the Congo, Shenzhen, China, Chonquing, China, Guanzhou, China, Lahore, Pakistan.

Read more: Make Cities Explode in Size With These Interactive Maps By Esri , Natasha Geiling, September 30, 2014.

Urban Layers of Manhattan

Explore the structure of Manhattan’s urban fabric.

morphocode-urban-layers

Urban Layers is an interactive map created by Morphocode that explores the structure of Manhattan’s urban fabric.

The map lets you navigate through historical fragments of the borough that have been preserved and are currently embedded in its densely built environment. The rigid archipelago of building blocks has been mapped as a succession of structural episodes starting from 1765.